Some Useful Tools Used in Python and Machine Learning
tqdm
Installation
pip install tqdm
or
conda install -c conda-forge tqdm
Usage
from tqdm import trange

for i in trange(1000):
  pass
visdom
Installation
pip install visdom
Executing
visdom      # default port 8097
or
python -m visdom.server -port 8888       # select an other port
Open the address in Chrome: http://localhost:8097/ or http://localhost:8888/.
In the code:
from visdom import Visdom
vis=Visdom(env="env-name", port=8888)
The terminal will print the following information:
Setting up a new session...
Usage
- Support for
tensor and arraydata structures inPyTorch,Torch,Numpy. env: default ismain, set withvis = visdom.Visdom(env='env1', port=8888).pane: display image, line, text, histgram, bar, pie, etc.win: name of apane.opts:opts=dict(title=, legend=, xlabel=, ylabel=, width= ).update:update='append'.
- Click button
saveto save current env as a file named*.jsonin the path~/.visdom/, also the name of env can be modified and clickforkto save.
Example 1:
import torch
import visdom
vis = visdom.Visdom(env='test1')
x = torch.arange(1,30,0.01)
y = torch.sin(x)
vis.line(X=x,Y=y,win='sinx',opts={'title':'y=sin(x)'})

# append 追加数据
for ii in range(0, 10):
  # y = x
  x = torch.Tensor([ii])
  y = x
  vis.line(X=x, Y=y, win='polynomial', update='append' if ii > 0 else None)

# updateTrace 新增一条线
x = torch.arange(0, 9, 0.1)
y = (x ** 2) / 9
vis.line(X=x, Y=y, win='polynomial', name='this is a new Trace')

# 可视化一个随机的黑白图片
#vis.image(torch.randn(64, 64).numpy())

# 随机可视化一张彩色图片
vis.image(torch.randn(3, 64, 64).numpy(), win='random2')

# 可视化36张随机的彩色图片,每一行6张
vis.images(torch.randn(36, 3, 64, 64).numpy(), nrow=6, win='random3', opts={'title':'random_imgs'})

vis.text(u'''<h1>Hello Visdom</h1><br>Visdom是Facebook专门为<b>PyTorch</b>开发的一个可视化工具,
         在内部使用了很久,在2017年3月份开源了它。
         Visdom十分轻量级,但是却有十分强大的功能,支持几乎所有的科学运算可视化任务''',
         win='visdom',
         opts={'title': u'visdom简介'}
         )
Example 2:
import visdom

vis = visdom.Visdom(env=path_to_results_dir)
vis_plot(vis, results_dict)

def vis_plot(viz, log_dict):
  if viz is not None:
    for field in log_dict:
      if len(log_dict[field]) > 0:
        _, values = zip(*log_dict[field])
        plot_data = np.array(log_dict[field])
        viz.line(X=plot_data[:, 0], Y=plot_data[:, 1], win=field, opts=dict(title=field, legend=[field]))
pickle
- Save and load data.
Save data
import pickle

a_dict = {'da': 111, 2: [23,1,4], '23': {1:2,'d':'sad'}}

# pickle a variable to a file
file = open('pickle_example.pickle', 'wb')
pickle.dump(a_dict, file)
file.close()
Load data
# reload a file to a variable
with open('pickle_example.pickle', 'rb') as file:
  a_dict1 =pickle.load(file)

print(a_dict1)
argparse
--start-epochand--start_epochhave the same effect.action='store_true'denotes:python main.py: the value oftrain_modeis False.python main.py --train_mode: the value oftrain_modeis True.
import argparse

parser = argparse.ArgumentParser(description = 'TEST')
parser.add_argument('--start-epoch', default = 0, type = int, help = 'please input number')
parser.add_argument('--train_mode', action='store_true', default=False)
parser.add_argument('--method', default='mdp', choices=['mdp', 'pr_mdp', 'nr_mdp'])

def main():
  args = parser.parse_args()

  print(args)
  print(args.start_epoch)
  if args.train_mode:
    print(args.train_mode)
    pass

  if args.method == 'mdp':
    pass

if __name__ == '__main__':
  main()
os
os.environ
- 读取环境变量。
os.environ.keys()

os.environ.get('PATH')
os.path.abspath(__file__)
- 获取当前脚本的绝对路径。
- 必须在Python脚本中使用,在交互模式或者terminal中无效。
import os
print(os.path.abspath(__file__))

print(os.path.dirname(os.path.abspath(__file__)))  # 当前文件的上一层目录的绝对路径

print(os.path.dirname(os.path.dirname(os.path.abspath(__file__))))  # 当前文件的上上层目录的绝对路径
matplotlib
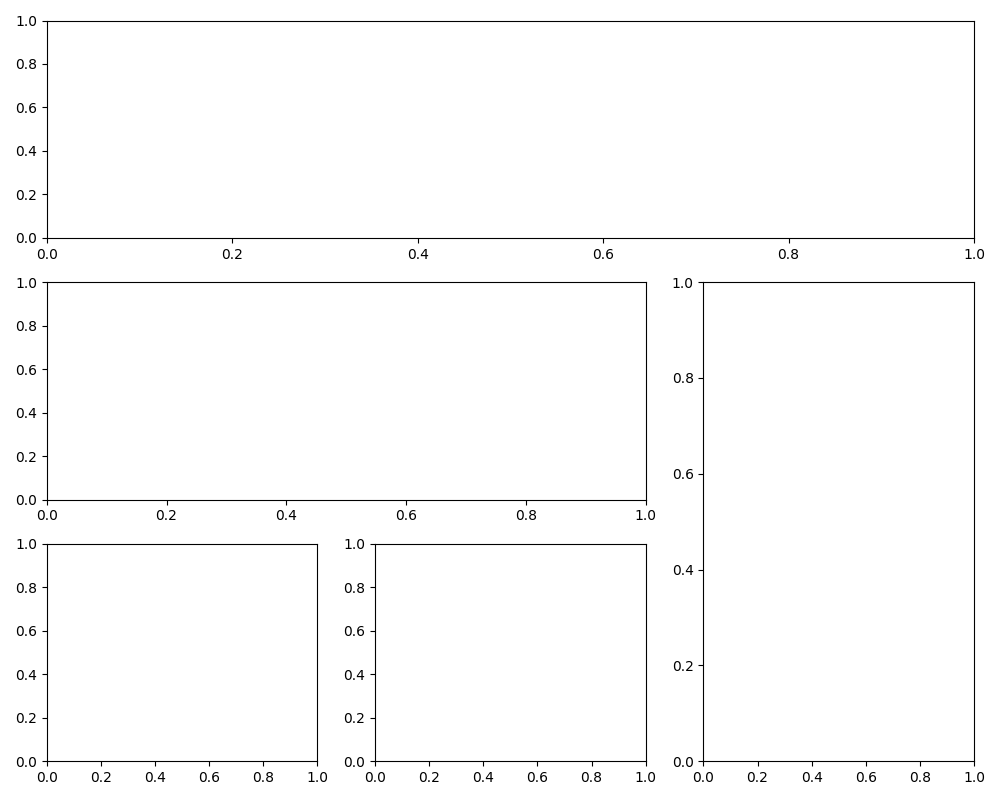
matplotlib.gridspec
- 将figure进行区域分割。
import matplotlib.pyplot as plt
import matplotlib.gridspec as gridspec

plt.figure(figsize=(10, 8), tight_layout=True)  # 设定fig尺寸和子图的自适应显示,防止坐标数字重叠
gs=gridspec.GridSpec(3,3)  # 划分为3行3列

ax1=plt.subplot(gs[0,:])
ax1=plt.subplot(gs[1,:2])
ax1=plt.subplot(gs[1:,2])
ax1=plt.subplot(gs[-1,0])
ax1=plt.subplot(gs[-1,-2])

plt.show()
scikit-learn
- https://scikit-learn.org/stable/index.html
- for machine learning
- open source
- simple and efficient tools for predictive data analysis
- 用途
- classification
- regression
- gaussian processes
- GPR
- GPC
- kernels
- gaussian processes
- clustering
- dimensionality reduction
- model selection
- preprocessing